By matching DNA results with gene expression databases researchers can determine the tissues and cell types involved in various diseases. For ME/CFS, the results strongly point to neurons. One of the top hits is the medium spiny neuron, located in a region deep inside the brain called the striatum.

The DecodeME study has given us a wealth of genetic data. It measured the DNA of more than 15.000 people with ME/CFS, showing which genetic variants are associated with the disease. But what are the implications, and which biological mechanism does it point to? In this article, we’ll try to shed light on that question by leveraging databases on gene expression.
These databases collected RNA in dissections from lab animals or deceased humans. RNA is the intermediary between DNA and the proteins it makes. An atlas of RNA measurements therefore tells us which genes are expressed in different tissues and cells across the body. By matching the genes highlighted by DecodeME to these RNA databases, we can assess which tissues and cell types are potentially involved in ME/CFS pathology.
| Technical section: how does it work exactly? In the enrichment analyses below we use two tools, MAGMA and LDSC, to match DNA results to the gene expression databases. Both work in a similar way. They start with the millions of DNA letters that DecodeME or other genetic studies provide. For each letter (the technical term is SNP – single nucleotide polymorphism), there’s a p-value for the comparison between ME/CFS patients and controls. The bigger the difference in how often a DNA letter occurs in patients versus controls, the lower the p-value will be. Both MAGMA and LDSC therefore treat these p-values as an indication of how strongly the SNP is associated with ME/CFS. They look at all the SNPs, not just those that reach the threshold of statistical significance (p < 5*10^-8 ). Both tools convert the association with SNPs to an association with genes. This is quite a tricky thing to do. Most of the SNPs are not part of genomic regions that give direct instructions for making a protein. They fall somewhere in between, and it is often unclear which genes and proteins they influence. MAGMA and LDSC take a conservative guess. They only assign SNPs that fall inside a gene or within a close window around that gene which you can specify (for example 30 kilobase pair). In MAGMA, the p-values for all those SNPs are combined into a single p-value for the gene. This indicates how much the gene is linked to ME/CFS. In some cases, the allocation to a gene will be incorrect but because proximity is a reasonable guess and it’s done for thousands of genes, the method picks up the overall signal quite well. Another issue is that SNPs are not independent but often correlated with each other. This is called linkage disequilibrium (LD), and it’s one of the main hurdles when doing genetic analyses. MAGMA and LDSC use a reference panel, for example from the 1000 Genomes Project, to calculate the correlation for each relevant SNP pair. The statistical analysis then corrects for this LD, so that the same signal isn’t counted twice. When those two issues are taken care of, LDSC and MAGMA use a straightforward linear model to check if the genes associated with ME/CFS match the genes associated with a tissue or cell type. Most versions also correct for confounders such as gene size. |
Neuronal communication
A seminal paper that introduced this approach was published in 2018 by Hilary Finucane and colleagues. It used various RNA datasets and genetic data from multiple diseases. The results show that gene enrichment analyses are surprisingly good at picking out the relevant cell types for each pathology. For rheumatoid arthritis, asthma, and Crohn’s disease, it highlighted immune cells; schizophrenia and epilepsy were associated with the central nervous system, while pancreatic cells came up for diabetes. For most of these diseases, the pathology was already partly understood, so this came as a confirmation rather than a breakthrough.
For a poorly understood disease like ME/CFS, however, the results could be far more interesting. We added the DecodeME data to the analysis pipeline of Finucane et al. and found that it points to the central nervous system and, more specifically, neurons in the brain. The signal was surprisingly strong.
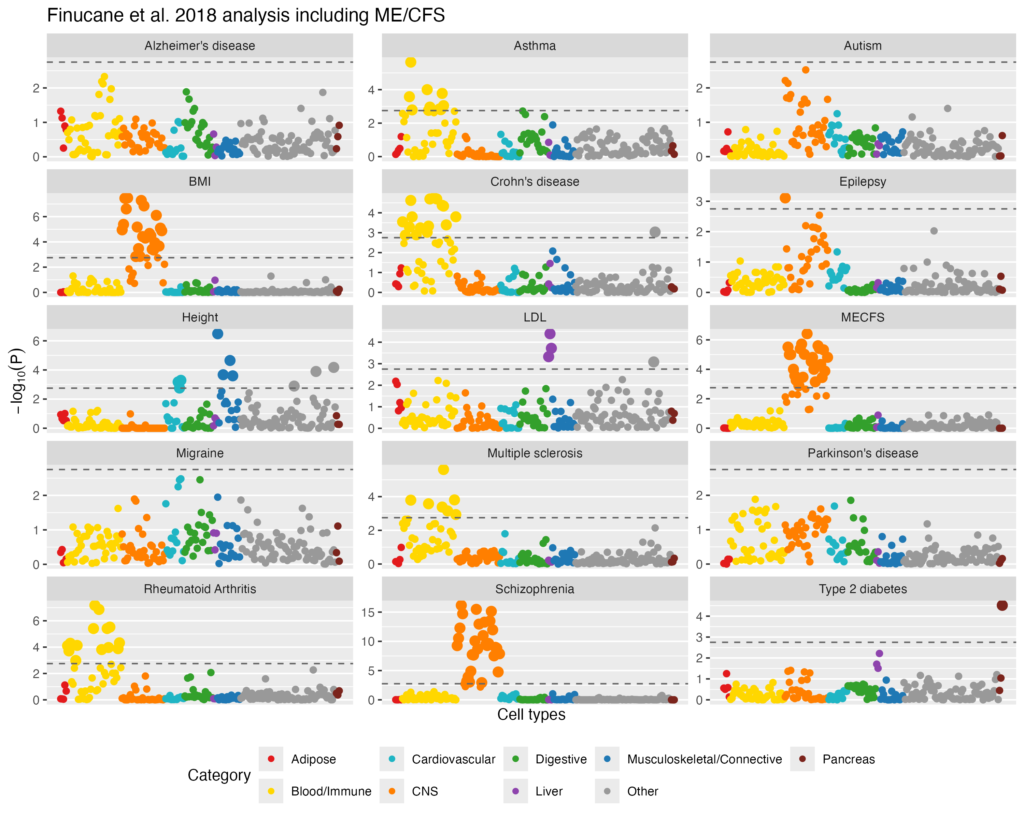
This is a finding that comes up in almost every tissue or cell enrichment analysis. It was already in the DecodeME preprint (which used the GTEx data), in the analysis by Paolo Maccallini (who used Dropviz and the Human Brain Atlas), and in the preprint by Jun Hyun Lee (which used the DESCARTES Human Atlas). Adding genetic data from ME/CFS patients in the Million Veteran Program (MVP), as Maccallini did, leads to the same conclusion. Neural communication already came up in Michael Snyder’s study on rare gene mutations and in our previous analysis of DecodeME genes associated with ME/CFS.
We can also arrange genes into categories other than cell types, for example, based on their biological function. We can apply the same analysis and check how genes associated with ME/CFS match these categories. The Maccallini preprint used this approach and found that the top hits also point to neurons and the communication between them. ‘postsynaptic specialization’, ‘neuron to neuron synapse’ and ‘somatodendritic compartment’ were some of the categories that reached statistical significance.
| FULL_NAME | P-value |
| GOCC_POSTSYNAPTIC_SPECIALIZATION | 9.79E-08 |
| GOCC_NEURON_TO_NEURON_SYNAPSE | 1.68E-06 |
| GOCC_SOMATODENDRITIC_COMPARTMENT | 1.79E-06 |
| REACTOME_NEURONAL_SYSTEM | 6.30E-06 |
| GOCC_GLUTAMATERGIC_SYNAPSE | 9.80E-06 |
| GOCC_POSTSYNAPTIC_DENSITY_MEMBRANE | 1.89E-05 |
| GOCC_AMPA_GLUTAMATE_RECEPTOR_COMPLEX | 2.59E-05 |
| GOCC_POSTSYNAPSE | 2.64E-05 |
| GOCC_NEURON_PROJECTION | 3.20E-05 |
| GOMF_INORGANIC_MOLECULAR_ENTITY_TRANSMEMBRANE_TRANSPORTER_ACTIVITY | 3.20E-05 |
| REACTOME_TRANSMISSION_ACROSS_CHEMICAL_SYNAPSES | 3.21E-05 |
| GOCC_SYNAPTIC_MEMBRANE | 3.23E-05 |
In other words, multiple analyses and genetic data sources point in this direction. The message might not have spread across our community yet, but there’s now substantial evidence that neuronal cell types are involved in ME/CFS pathology. Either the genetic studies like DecodeME are way off (possible but unlikely), or this is a region (the brain) and cell type (neurons) that is key to ME/CFS.
We also tested other datasets, such as the Immunological Genome Project (ImmGen, analysis 3), but no immune cell type showed a significant association with ME/CFS. We may find such a link in the future if more DNA samples from ME/CFS patients are available, but currently it’s neurons and not immune cells that stick out.
| The ME/CFS Bioinformatics Repository We’re amateurs, so it’s possible that we made a mistake in one of our analyses. Luckily, there are now multiple people doing these genetic analyses and they are getting similar results. One rich resource we recommend is the ME/CFS Bioinformatics Repository. It’s created by Trafalmadorian97 and includes many other interesting analyses besides the ones discussed in this blog article. Trafalmadorian97 also applied the DecodeME data to the analysis pipeline of Finucane et al. 2018. You can view their results here. |
The human brain atlas
Next, we tried to go one level deeper: is it possible to test which type of neuron or which brain region is involved in ME/CFS? This is much more difficult to determine, unfortunately. Brain regions and neuronal cell types have similar gene expression. Even if only one is associated with the disease, others will appear in our results because they look alike. We won’t be able to tell which ones have a real connection to the disease and which ones are just hitching along as false positives.
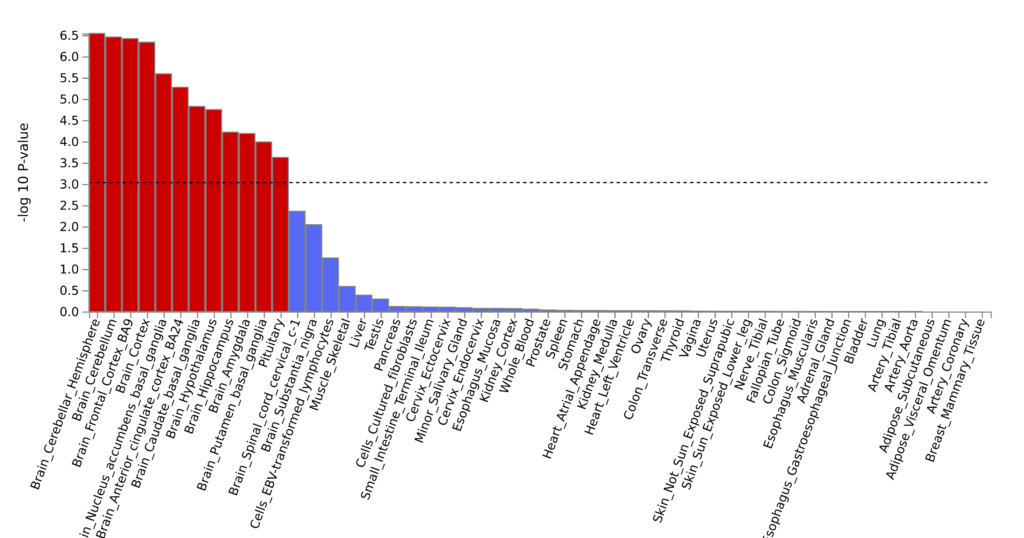
We likely see this problem at play in the tissue analysis using the Genotype-Tissue Expression (GTEx) data. Pretty much all brain regions light up as significantly associated with ME/CFS. Either this means that the risk is spread out across the brain or the genetic signal is simply unable to differentiate between them.
For our cell type analysis, we use the Human Brain Atlas. It’s the most extensive dataset on brain cells in humans and was published in 2023 by the team of Sten Linnarsson at the Karolinska Institute. The atlas collected RNA from 3 million cells and organized them into 461 cell types. The researchers didn’t choose these cell types themselves; they were determined by a clustering algorithm based on similarity in gene expression of individual cells.
Matching genetic data from ME/CFS patients to this Human Brain Atlas gave the following results.
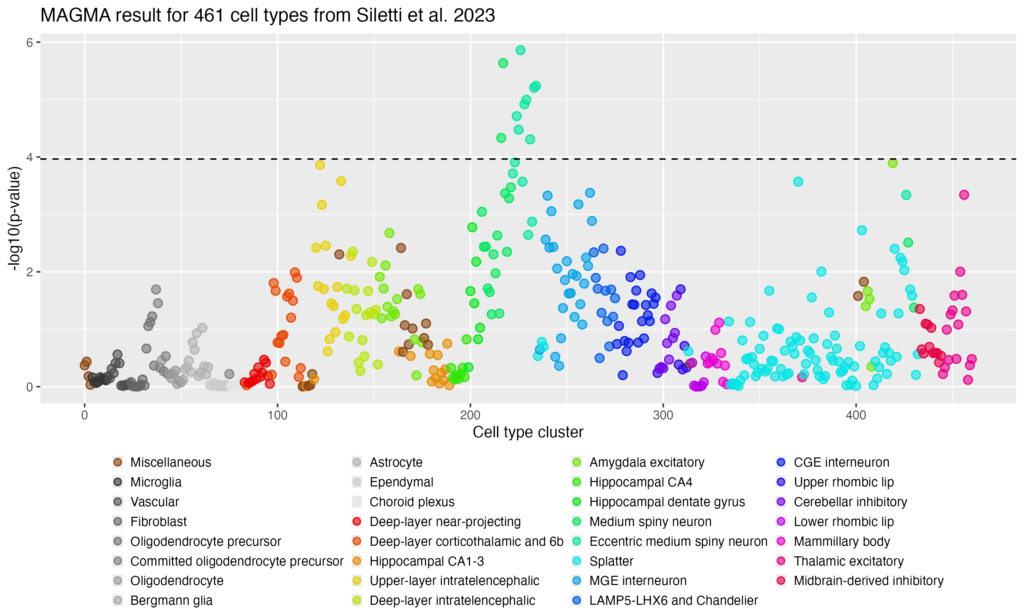
Each dot is a cell type, and they are arranged into 31 categories shown in different colors. The strongest results were found for the medium spiny neurons, which are located in the striatum.
Dropviz
Next, we looked at the Dropviz brain atlas from researchers at Harvard University. This dataset determined cell types in mice instead of humans. Brain samples are much easier to obtain from lab animals, but the downside is that genes must be translated to their human counterpart. This approach is far from ideal but it’s often worthwhile to tackle a problem from different angles and see if the results hold up.
Using Dropviz, 13 out of 565 cell types from the mouse brain reached statistical significance for ME/CFS. Seven are neurons from the striatum. (Note: the globus pallidus cell types in the table below were actually striatal cells as explained in the Dropviz paper; the naming is a bit confusing).
| Cell Type | Brain region |
| GP.Neuron_Gad1Gad2-Th_Adora2a-Th.3_9 | Globus Pallidus/ Striatum |
| STR.Neuron_Gad1Gad2_Drd1-Cxcl14.10_5 | Striatum |
| HC.Neuron_Slc17a7_C1ql2-Penk.4_2 | Hippocampus |
| HC.Neuron_Slc17a7_Pvrl3-Grm5.6_2 | Hippocampus |
| HC.Neuron_Slc17a7_C1ql2-Cck.4_1 | Hippocampus |
| STR.Neuron_Gad1Gad2_Drd1-Nefm.10_4 | Striatum |
| PC.Neuron_Slc17a7_Syt6-Sla.1_4 | Posterior Cortex |
| FC.Neuron_Gad1Gad2_Synpr-Pcdh11x.1_6 | Frontal Cortex |
| GP.Neuron_Gad1Gad2_Adora2a.3_3 | Globus Pallidus/ Striatum |
| GP.Neuron_Gad1Gad2_Drd1-Nefm.3_1 | Globus Pallidus/ Striatum |
| STR.Neuron_Gad1Gad2_Drd1-Otof-Sorcs1.13_2 | Striatum |
| STR.Neuron_Gad1Gad2_Adora2a-Nefm.11_1 | Striatum |
| PC.Neuron_Slc17a7_Syt6-Nefm.1_8 | Posterior Cortex |
Linnarsson Mouse Brain Atlas
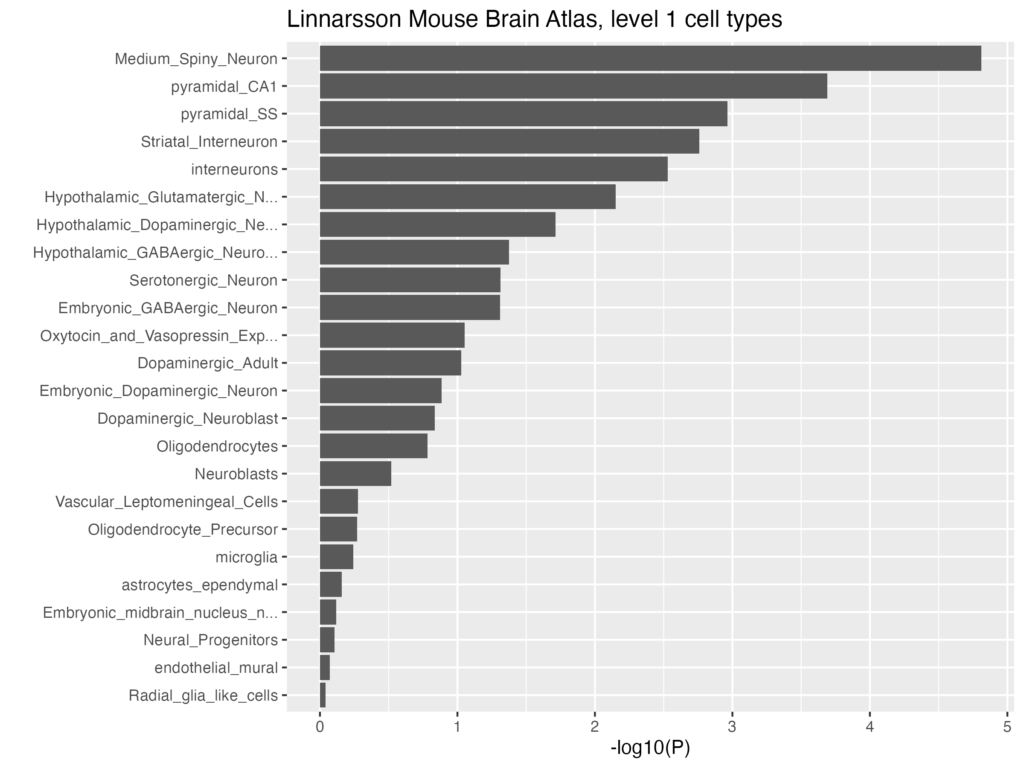
We’ve searched for other suitable RNA resources and found an older and smaller Mouse Brain Atlas from the Linnarsson team, which has been used in several papers. Medium spiny neurons were once again a good match for ME/CFS, although the results were less robust and changed depending on how you analyzed them (see our analysis here).
The more gene enrichment analyses we can do, the better we’ll understand the genetic signals for ME/CFS. We’re therefore keeping an overview of all relevant RNA datasets and their results in the following thread on the Science for ME forum.
Overview of RNA datasets for tissue and cell type enrichment analysis | Science for ME
Medium spiny neurons
Let’s zoom in on one of the most significant hits: medium spiny neurons. They are the dominant cell type of the striatum, a region located deep inside the brain. Simply put, the striatum acts like a gate. It receives excitatory input from other brain regions, such as the cortex and thalamus, and helps decide which of these signals are worth acting on. That decision is shaped by dopamine arriving from the midbrain. The striatum is, for example, crucial for initiating voluntary movements, and it requires sufficient dopamine input to work correctly. In Parkinson’s disease, dopamine-producing cells are depleted which contributes to its characteristic tremor and disrupted movements.
Medium spiny neurons are the dominant cell type in the striatum. They receive glutamatergic input but use GABA as output to inhibit neural networks. Researchers categorize them by their dopamine receptors: D1 enhances excitability while D2 decreases excitability. Recently, the Dropviz and Human Brain Atlas discovered a third type that can have both D1 and D2 receptors. These were called ‘eccentric’ medium spiny neurons (eMSN). They are less common but have a distinct genetic profile compared to the other medium spiny neurons. In the Human Brain Atlas, it was mostly the eMSN that had the best match with ME/CFS. They are suspected to be involved in behavior that involves weighing conflicting info, but their function is largely unknown.
These cells are far from unique to ME/CFS. The graph below shows results for various other conditions matched to the Human Brain Atlas. For multiple sclerosis, the signal points to infiltrated immune cells such as B- and T-cells. In Alzheimer’s, the microglia stick out. For ME/CFS, the top cell type is (eccentric) medium spiny neurons but these are also highlighted in various traits that involve the brain, such as sleep duration, schizophrenia, depression and alcohol consumption.
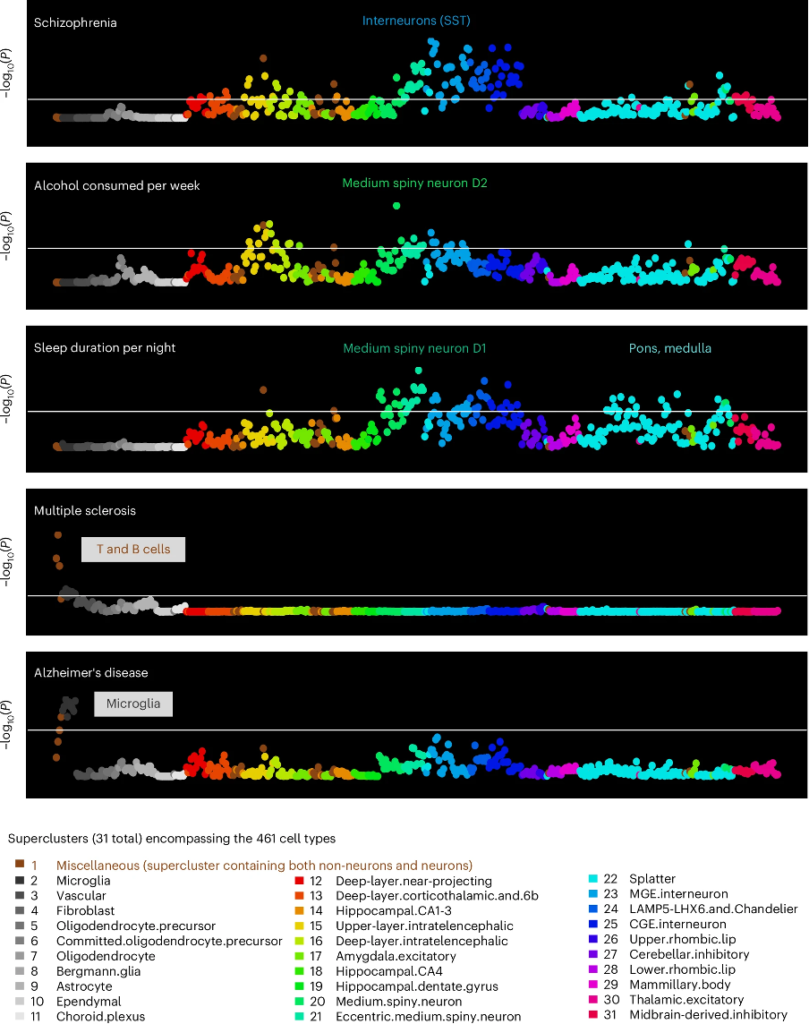
A symptom signal?
What relevance could these cells have to ME/CFS? One hypothesis is that they are involved in symptom signalling in the brain. More than 25 years ago, two neurologists and ME/CFS specialists, Abhijit Chaudhuri and Peter Behan, speculated that this brain region plays a crucial role in the experience of fatigue. They proposed that central fatigue results from a failure of the “non-motor function” of the “striatal-thalamic-frontal cortical system”. They argued that there’s a complex feedback loop between the striatum and brain regions that process sensory input and reasoned that this is where the experience of fatigue must be generated.
There’s some (weak) evidence to support this. The cortico-striatal network has been associated with fatigue in various brain scan studies. One PET scan study found that patients receiving interferon-alpha therapy showed increased glucose metabolism in the striatum, which correlated with fatigue scores.
It has long been speculated that the malaise and fatigue experienced during acute infections are prolonged by a distorted process in ME/CFS. Perhaps the genetic findings from Decode point to the brain networks that generate these symptoms. While immune and other causes for patients’ symptoms might be too heterogeneous to show up in genetic analyses, they might all converge on neural circuits that generate these symptoms. In other words, neural communication might show up because it’s the common endpoint among patients with the diagnosis of ME/CFS. Small changes in how these neurons are wired and connected might slightly increase the risk of ME/CFS.
Limitations
We’ll write more about this hypothesis in future blog articles. First, it’s time to highlight some important limitations.
- Dr. Rachel Brouwer (Vrije University Amsterdam) recently conducted a comprehensive review of cell enrichment analysis. She found that the method is reliable for identifying broad cell types (e.g neurons), but less robust for more specific categories. At a finer level, the results become highly dependent on the analysis tools and parameters that you choose. We tried to focus on findings that survive different analysis choices, but bear in mind that the findings for medium spiny neurons are far less reliable than the association with neurons in general.
- Second: other cell types are significantly associated with ME/CFS as well, depending on the RNA atlas that you use. For example, glutamatergic neurons in the cerebellar white matter were significant in the 2023 Seeker dataset, while inhibitory interneurons came up in the DESCARTES dataset from fetal samples. We focused on the Siletti et al. 2023 dataset, however, because it’s the most relevant dataset to analyze the human brain.
- We also saw that (eccentric) medium spiny neurons show up in multiple brain traits and diseases. Their association with ME/CFS is thus far from unique. One reason for highlighting them is that some of the genes with the strongest link to ME/CFS such as HTT, GPR52, and TSHZ3, also point to the striatum. We hope to write more about this in future blog posts.
- Lastly, we don’t know if we’re looking for a cell type in the first place. The pathology of ME/CFS might involve something more specific, a defect that isn’t restricted to certain neuronal cell types. It could be that medium spiny neurons have nothing to do with ME/CFS but just show up because they have genes in common with whatever does cause the disease.
Despite all these limitations, we think that matching DNA results of ME/CFS patients with gene sets, tissue and cell types is a powerful approach. It helps to understand the genetic signal and the processes and cells that are likely involved in it.
Technical specifications
Analysis 1
ME/CFS data: DecodeME analysis 1 (DME_1)
RNA data: GTExv6 + Franke lab data accessed using this Google Cloud bucket
Method: stratified LDSC following the approach of Finucane et al. 2018
Analysis 2
ME/CFS data: meta-analysis of DME_1 and the European ME/CFS data in the Million Veteran Program (MVP). Using DME_1 gives similar but messier results with no gene category reaching significance.
Gene categories data: MSigDB v2023.1Hs gene-set file downloaded from FUMA.
Method: MAGMA with window size of 0,0.
Analysis 3
ME/CFS data: DME_1
RNA data: ImmGen data, phase 1 (GSE15907) and phase 2 (GSE37448) provided by Finucane et al. 2018.
Method: stratified LDSC following the approach of Finucane et al. 2018.
Analysis 4
ME/CFS data: metanalysis of DME_1 and MVP
RNA data: tissue data from GTEx8 provided by FUMA
Method: MAGMA with window size of 0,0.
Analysis 5
ME/CFS data: meta-analysis of DME_1 and MVP
RNA data: The Siletti et al. 2023 Human Brain Atlas, processed by Duncan et al. 2025.
Method: MAGMA with window of 30,10 following the approach by Duncan et al 2025.
Analysis 6
ME/CFS data: meta-analysis of DME_1 and MVP
RNA data: We used the pre-processed file provided by the FUMA website that controls for average gene expression in the dataset.
Method: MAGMA with window size of 0,0.
Analysis 7
ME/CFS data: DME_1
RNA data: Level 1 of the Linnarson Mouse Brain Atlas provided by Skene et al. 2018 in The R package MAGMA_celltyping. We used the NCBI37.3.gene.loc file to match genes to Entrez IDs.
Method: We used MAGMA using the 40 quantiles on all SNP (no restriction to the HapMap3 SNP list). An overview how different analysis choices influence these results is available here.
It’s an interesting lead. Thanks for putting a well distilled summary because following all the threads around S4ME was getting somewhat confusing.
The relevance of the striatum in Tremors is particularly interesting to me because I experience tremor like movement “interior vibrations” or whatever especially when wired and I know this isn’t unique to me in the ME/CFS community.
Anyways, cheers for the post. Hope this leads somewhere, and if it does, that somewhere proves to have easier disease modifying targets than Parkingsons.